An English translation draft of the supplied Chinese article. Figure labels remain in Chinese; the captions below are translated. Technical references are retained from the source article and have not been independently reverified during this website conversion.
Understanding depth-sizing deviations in in-service heat exchanger tubes
“This tube is already leaking, so the flaw must go through the wall. Why does the eddy current report still call it an OD flaw with a depth of only a little over 80%? Does that mean the inspection result is unreliable?”
Anyone who has inspected in-service heat exchanger tubes has probably encountered this question.
The owner’s question is direct and reasonable: if leakage through the tube wall has been confirmed, why has the inspection result not reached 100%?
The inspector may also feel caught in the middle. Calibration was performed, the signal was analyzed, and the software returned just over 80% from the phase–depth curve. Knowing that the tube leaks is not a reason to change the reading directly to 100%.
Why can the actual through-wall condition differ from the depth value derived from an eddy current signal?
To answer that, we first need to consider how eddy current depth sizing works. This article focuses on conventional internal eddy current inspection of nonferromagnetic heat exchanger tubes, particularly differential bobbin probes and phase-based depth sizing. Other probe types are identified where discussed.
1. First establish what “the tube is leaking” means
Two field conditions should be checked before proceeding.
First, has the leak been confirmed to originate in this tube’s wall, at the location corresponding to the eddy current indication? Leakage at a tube-end connection and leakage through a tube-wall flaw should be considered separately.
Second, how much time elapsed between the inspection and discovery of the leak? If the equipment operated for some time after inspection, corrosion or flaw growth may have changed the condition between the two dates.
Once these points have been checked, if a through-wall leakage path was already present at the same location during inspection, local penetration is established. An eddy current value such as “85% OD” cannot overturn that fact.
However, local penetration does not mean that the entire damaged region is 100% deep. A large corroded area may contain only one very narrow, small channel that penetrates first. This distinction matters when interpreting the eddy current response.
2. How is the reported depth obtained?
Alternating current in the probe coil induces eddy currents in the tube. A flaw changes the current paths and electromagnetic field distribution, altering the probe impedance or received voltage.
The instrument measures this electromagnetic response. We then interpret and size the flaw using features such as phase, amplitude, and spatial distribution.
In a common phase-based procedure, a phase–depth curve is established using artificial flaws of known depth. The phase of a field indication is then compared with that curve.
Known flaws provide a measuring scale, and the field signal is compared against it.
The scale is useful. Its applicability depends on the similarities and differences between the field flaw and the calibration flaws.
3. Why does phase carry depth information?
Field amplitude decays and phase changes as the field penetrates
As an alternating electromagnetic field diffuses into a conductor, its amplitude decreases and its phase lags.
For a simplified planar model of a homogeneous conductor, using the corresponding sinusoidal steady-state representation, the magnetic field can be written as:
H(x) = H₀ · exp(−x/δ) · exp(−jx/δ)
Here, x is the distance into the material and δ is the standard depth of penetration:
δ = √[2/(ωμσ)]
ω is angular frequency, μ is magnetic permeability, and σ is electrical conductivity. These expressions use the time factor exp(jωt). The first exponential represents amplitude decay; the second represents phase lag.
The practical message is that material properties and frequency affect the amplitude and phase distribution through the wall.
For a probe inspecting from inside a tube, the field near the ID surface differs from that near the OD surface. Flaws at different locations, or extending to different depths through the wall, therefore disturb the field differently.
For example, as an OD flaw deepens, its boundary extends toward the ID surface, changing the disturbed current region and electromagnetic coupling. With a suitable probe, frequency, and flaw configuration, these changes can produce a usable phase–depth relationship. This is the physical basis of phase-based depth sizing.
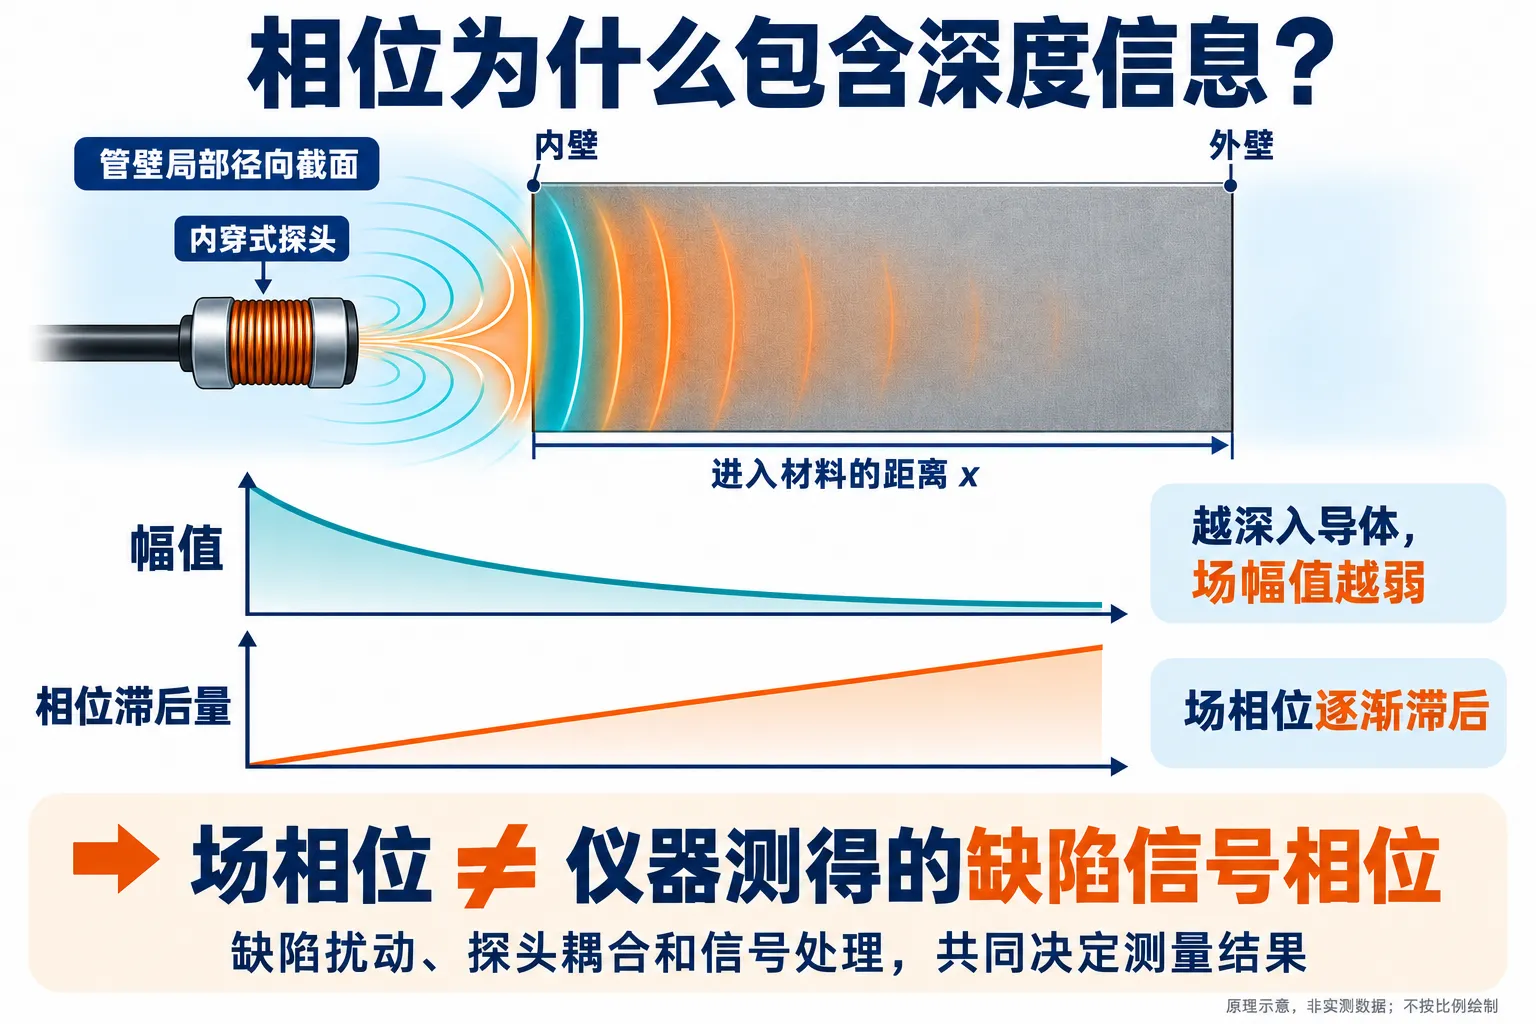
Figure 1. Amplitude decay and phase lag in a simplified homogeneous-conductor model. Distance into the material follows the radial direction through the tube wall. Field phase cannot be equated directly with the phase of the instrument’s flaw signal. The probe and field lines are conceptual.
Field phase is not the same as flaw-signal phase
A tempting leap is to assume that, because field phase varies with depth, measuring phase directly gives flaw depth.
A crucial step is missing.
In the equation, x identifies a position within the conductor. Reported flaw depth describes the flaw’s extent through the wall. These are different quantities.
The displayed signal also includes probe coupling, channel processing, and the prescribed measurement convention after the field has been disturbed by the flaw. For a differential bobbin channel, the commonly used peak-to-peak phase involves the difference between two coil responses and the selection of points on the waveform.
It is a combined response of the probe–tube-wall–flaw system, not a phase emitted independently by the deepest point.
Changes in flaw width, length, or orientation, or a nearby support structure, may change that combined response.
A phase–depth curve is therefore a relationship established under specified conditions. Depth is an important variable, but it is not the only one.
Rotating the through-hole signal to 40° during calibration sets a phase reference. The angle 40° is not a universal physical constant for every through-wall flaw.
4. Why can a through-wall flaw be reported as just over 80% OD?
Calibration flaws and service flaws may have different shapes
Artificial flaws are usually regular: through-holes, flat-bottom holes, circumferential grooves, or narrow slots with well-defined dimensions suitable for repeat manufacture and measurement.
Service flaws may include deep narrow pits, irregular wear, branched cracks, or combined corrosion and cracking. Even with the same maximum depth, they may obstruct and redirect eddy currents differently.
Liao Shusheng’s 2007 paper, Analysis of Reliability Deviations in Eddy Current Inspection of Steam Generator Tubes Based on the Finite Element Method, presented an early theoretical investigation of this issue. Under a particular RSEM calibration approach, with a 550 kHz differential bobbin probe and Inconel 690 tubing, groove depth was held constant while axial groove width was varied.
For an OD circumferential groove with a true depth of 40% wall thickness, the same calibration curve returned approximately 25%–43% wall thickness.
The depth stayed the same, but the inferred result changed. Changing groove width changed current diversion and probe coupling, and consequently the phase.
The study concerned regular circumferential grooves; its numerical range cannot be applied directly to real pits or cracks. It does, however, illustrate a basic point: differences in morphology and calibration conditions can cause method-related bias even without an operator measurement error. [1]
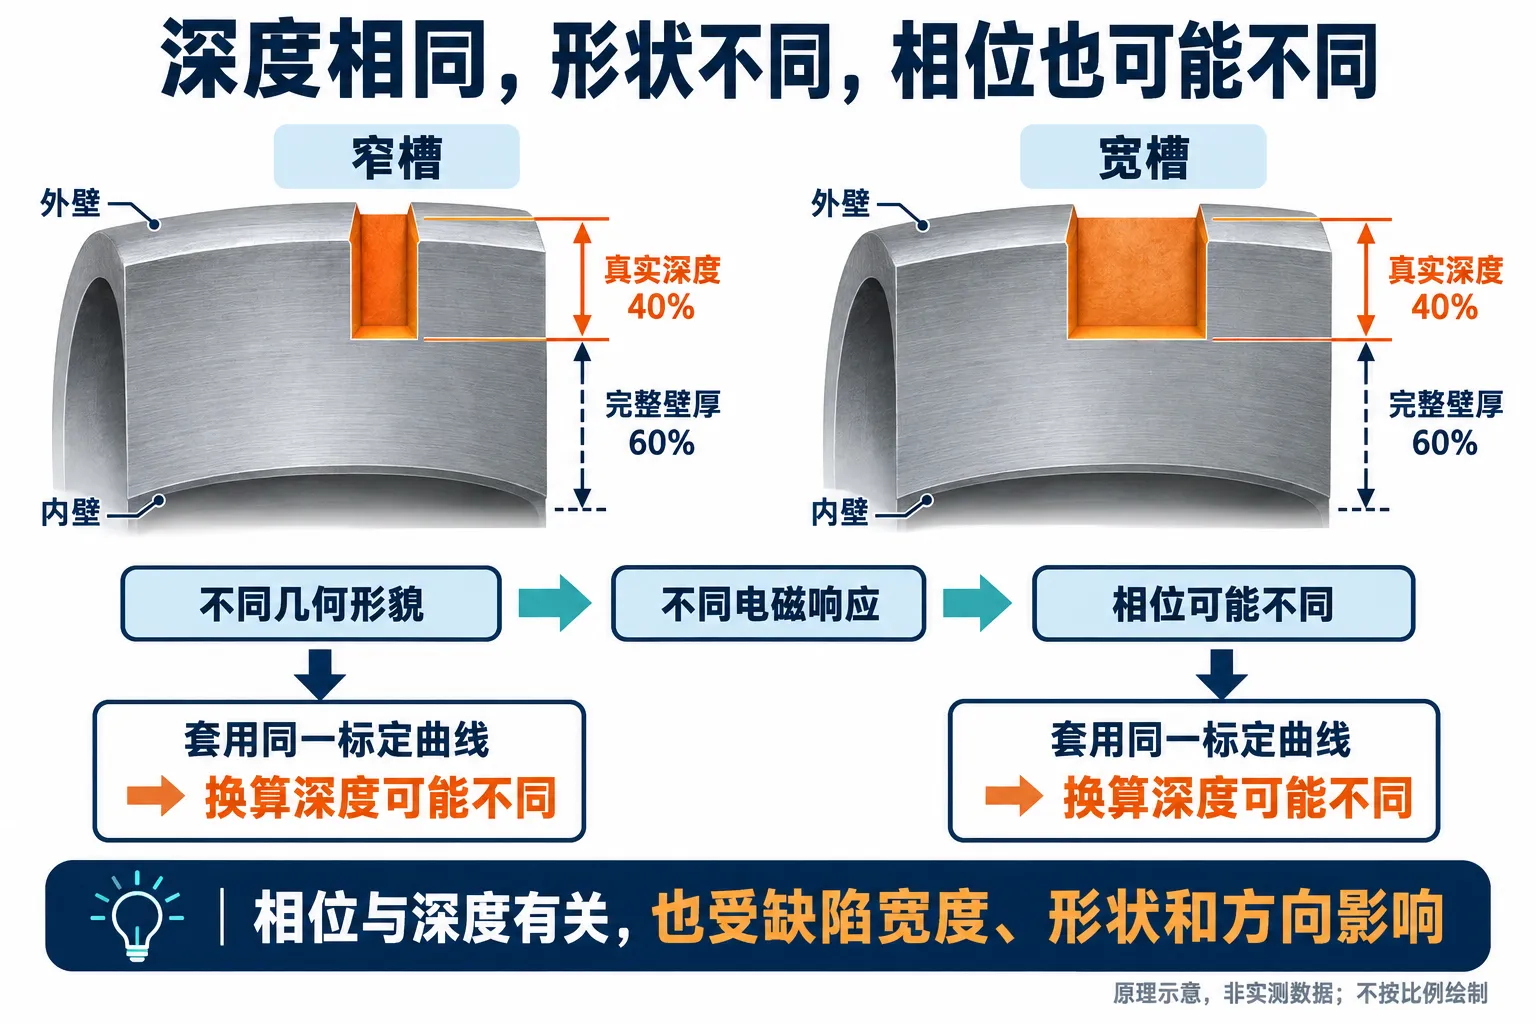
Figure 2. Two OD grooves of equal depth can produce different responses because of their different widths. This illustration does not represent a specific calculation in the source study and does not imply that wide or narrow grooves always bias the result in a particular direction.
Reaching 100% penetration does not guarantee the same phase
Artificial-hole experiments also support this distinction.
Feng Jun and colleagues reported in 2017 that through-hole phase varied with hole diameter under their experimental conditions. Some through-holes at least 2 mm in diameter had phases below the 40° through-wall calibration reference, appearing in the “ID angle” region.
All of these holes penetrated the wall, yet their signals did not share one reference angle. The 2 mm and 40° values belong to that study and are not universal limits for other tube materials or probes. The broader lesson is that the same through-wall condition does not guarantee the same electromagnetic response. [2]
Thus, a phase-based result of 85% means that this signal corresponds to 85% on the selected curve. Whether it accurately represents the local maximum depth depends on whether the curve applies to that flaw.
A small local penetration may not respond like a standard through-hole
Imagine a corroded region that remains unpenetrated over most of its area, but contains a small deep pit that has formed a leakage path.
The leak is controlled by that through-wall path. The eddy current signal is influenced by the entire damaged region and surrounding tube wall within the probe’s effective sensing region.
If the probe and analysis method do not adequately resolve the local penetration, the measured phase may not accurately represent the deepest point. Applying a curve based on regular artificial flaws may then return a value below 100%.
This is one physically plausible explanation for a leaking tube being sized at just over 80%. A specific case still requires evidence from actual morphology and raw signals; the two numbers alone do not establish the cause.
It is also misleading to say that eddy current testing measures “average depth.” A combined electromagnetic response is not the arithmetic average of geometric depths.
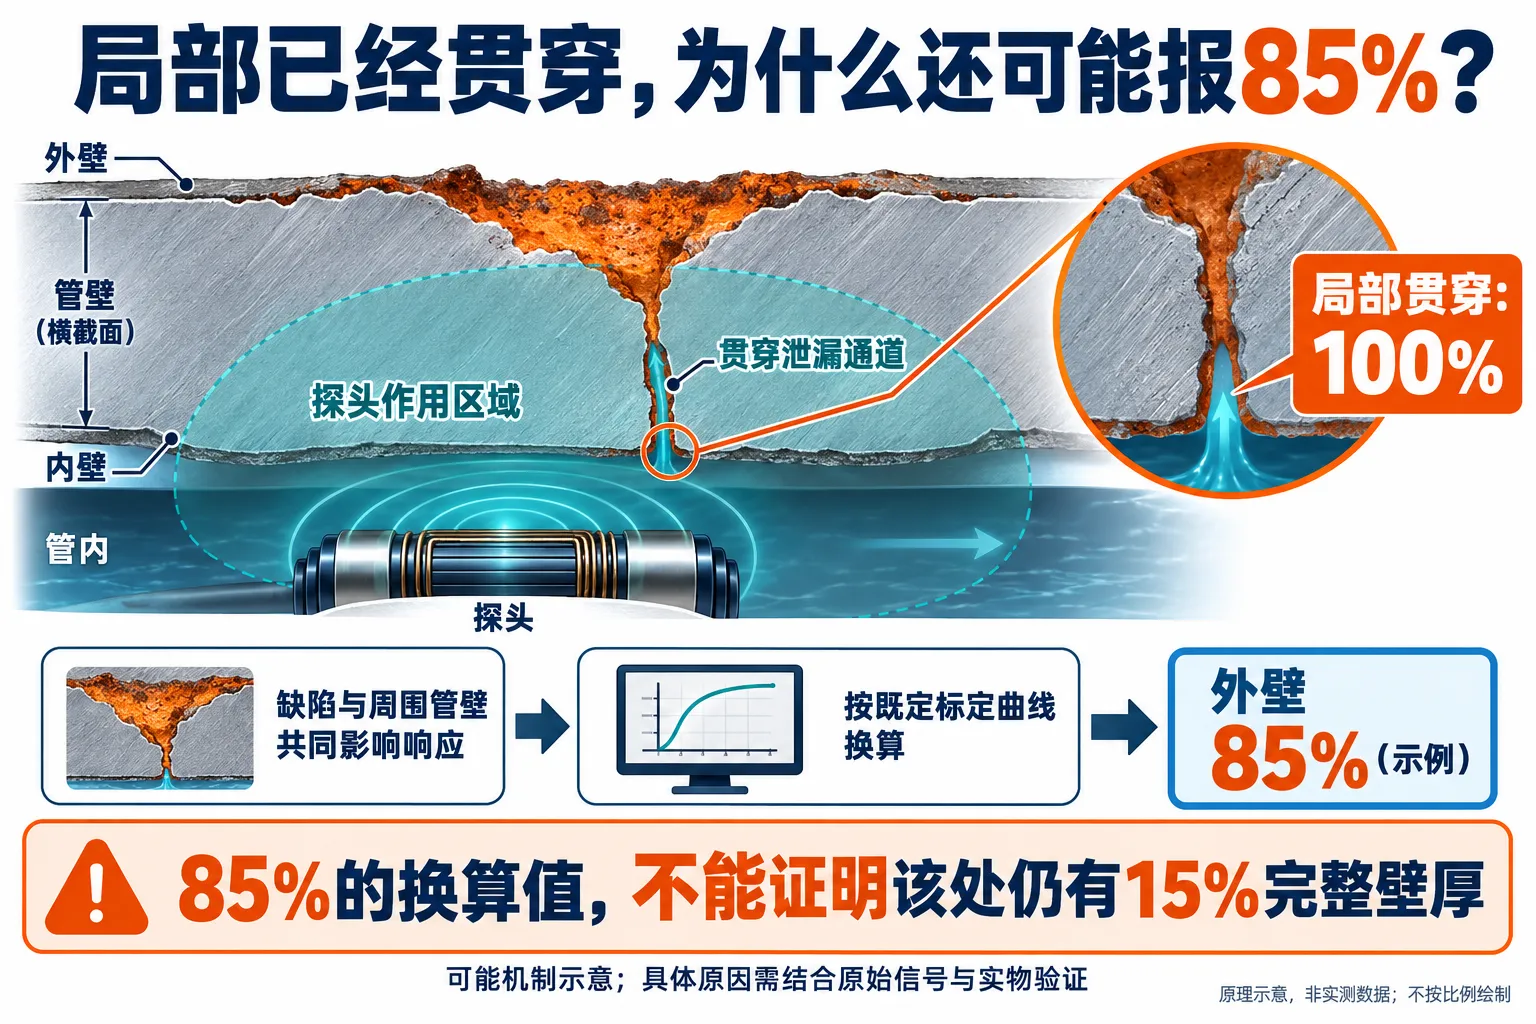
Figure 3. A small channel within a corroded region may penetrate first. The 85% value is an illustrative curve-derived estimate, not a verified field result. The screen curve represents only the conversion step; its shape, direction, and scale have no quantitative meaning here.
An 85% estimate does not prove that 15% intact wall remains at the leak location.
Background signals may rotate the measured phase
On an impedance plane, a flaw signal contains two orthogonal components. Adding responses from support structures, an expansion transition, or nearby damage can change the direction of the resulting signal.
Interference can therefore alter the phase used for sizing, beyond making the display look more complicated.
The U.S. NRC’s 2022 report NUREG/CR-7291 examined specimens with coexisting wear and stress corrosion cracking. For one specimen, a +Point phase-based depth profile gave a maximum estimate of approximately 70% wall thickness with the wear background retained, and over 90% after background suppression.
These values show that the background and processing approach can substantially affect the estimate. The report also cautions that background subtraction affects phase; the larger processed value should not automatically be treated as the true depth. [3]
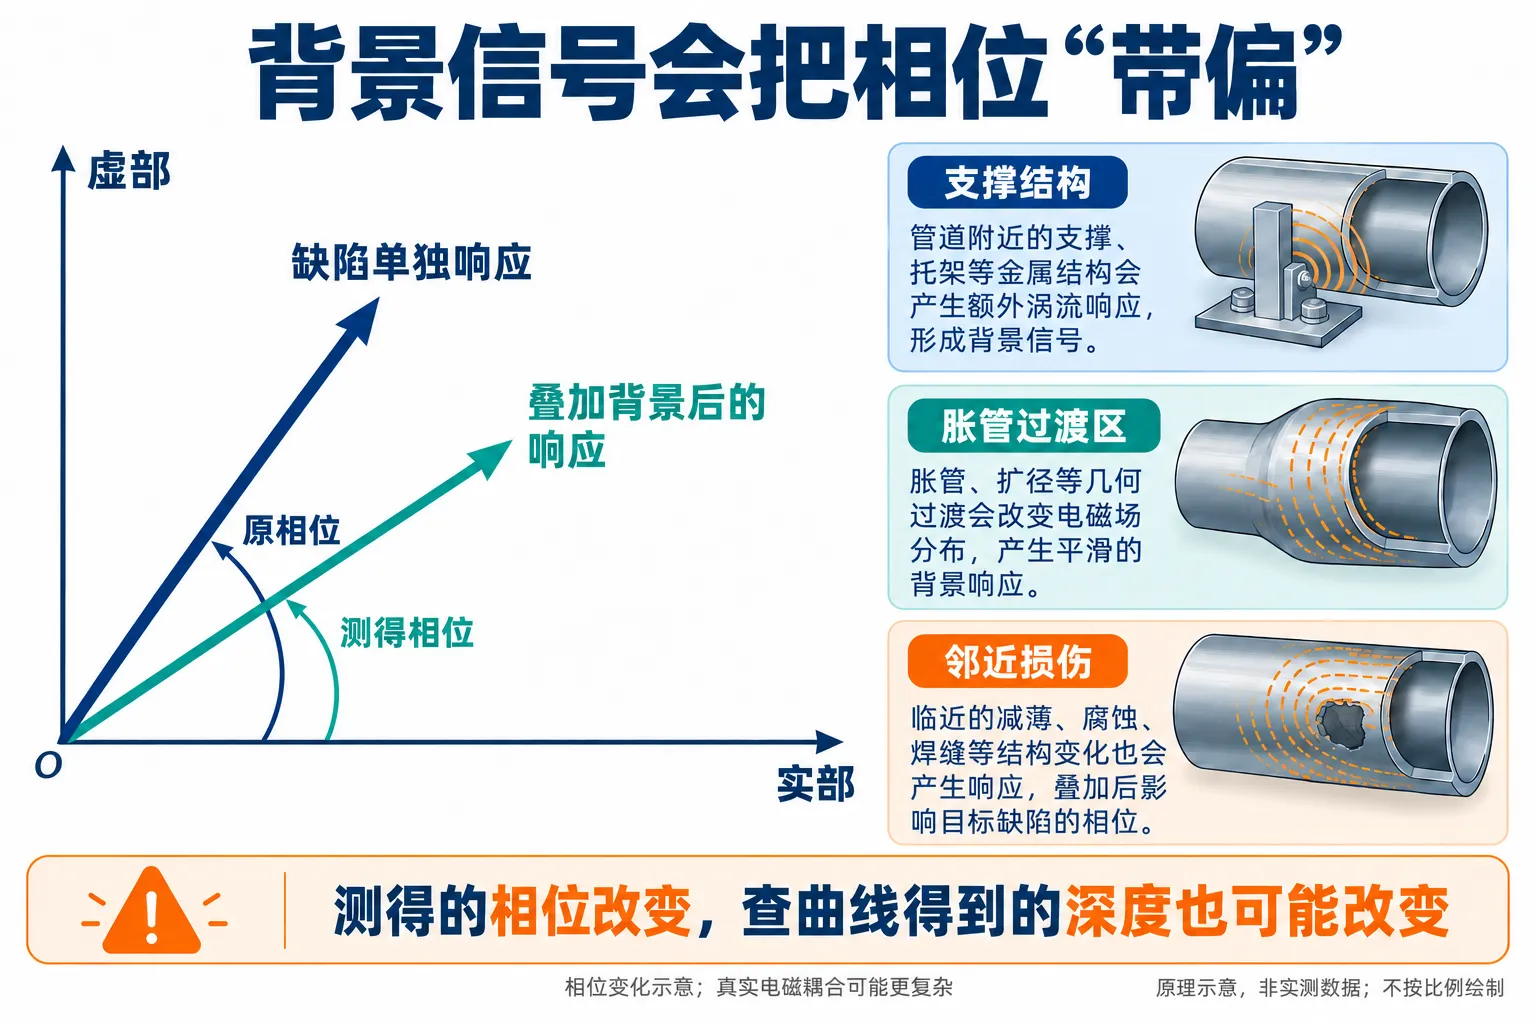
Figure 4. Background response can change measured phase. The arrows provide a qualitative comparison; their directions, lengths, and included angle are schematic. Interference does not necessarily cause underestimation.
Implementation and analysis still require review
Discussing physical limitations does not remove the need to review inspection quality.
Probe and frequency selection, calibration-tube compatibility, phase-point selection, the effect of mixing on the target signal, and recognition of combined cracking and wear can all affect the result.
The possibility of method-related bias does not mean every discrepancy is caused by the method.
5. A documented leaking tube was sized at 77%
U.S. NRC Information Notice 2004-17 describes leakage from a steam generator tube at Shearon Harris, with foreign-object wear subsequently identified. The damage was approximately 4 mm above the top of the tubesheet. The nearby expansion-transition signal masked the indication in conventional bobbin analysis; three-frequency mixing and +Point inspection identified the damage.
The +Point wear-depth estimate for the leaking tube was 77% wall thickness.
This closely resembles the situation discussed here. However, the notice did not use a destructive examination focused on that numerical result to attribute the discrepancy between 77% and penetration to one particular mechanism. It documents that the phenomenon occurred; it does not establish that all similar results are acceptable or that 23 percentage points is a universal error. [4]
The meaning of “OD” also needs clarification.
If it comes from phase-region classification, it describes the signal interpretation under the current rules. If independent evidence establishes that the damage originated on the OD surface, it describes damage origin. An OD-initiated flaw can eventually penetrate the wall.
Once local penetration is confirmed, however, the report should state that fact explicitly, so “85% OD” is not mistaken for “15% intact wall remains here.”
6. The difference between 80% and 100% is more than a number
For a tube with a 1 mm wall, the difference between 80% and 100% is 0.2 mm. That may sound small as a dimension, but the formation of a through-wall leakage path has a very different significance.
Bias does not always run toward underestimation.
In a 2024 pulled-tube verification study of titanium heat exchanger tubing with wear from a limiting rod, Nan Tong and colleagues reported a phase-based estimate of 73% for damage with a true depth of 18% wall thickness. The authors attributed the deviation to the rod structure’s influence on flaw phase. For that equipment and procedure, amplitude calibration matching the wear morphology better represented the depth trend, although a positive bias remained. This does not establish that amplitude sizing is more accurate for every flaw. [5]
It is therefore inappropriate to assume that eddy current testing always slightly underestimates depth or to add a fixed percentage correction.
Flaw length, circumferential extent, morphology, and damage mechanism also affect engineering significance. A single depth value cannot carry the entire integrity assessment.
7. How should such a discrepancy be investigated?
First correlate tube number, position, and time to confirm that the leakage location and eddy current indication refer to the same damage.
Then return to the raw data: examine calibration, signals at each frequency, absolute and differential channels, waveforms before and after processing, and phase-point selection. Reviewing only the final reported percentage is insufficient.
Next determine whether the actual damage lies within the validated scope of the sizing procedure. Applying a curve based on artificial holes to an irregular crack, or a free-span curve to a location with substantial structural interference, needs adequate justification.
Where practical, select supplementary probes or methods appropriate to the damage mechanism, and verify the condition by tube removal, morphology measurements, metallography, or another suitable technique. Supplementary methods also have limitations; changing methods does not automatically establish the true value.
The report should distinguish what was detected, how depth was estimated, whether through-wall evidence exists, and which conditions limit sizing confidence.
If reliable leakage evidence exists, state both the 85% estimate and confirmed leakage at that location, explicitly noting that the estimate does not demonstrate intact local remaining wall. Simply changing the reading to 100% would conceal a discrepancy worth investigating.
8. Use the phase curve and explain its limits
Phase–depth relationships have a physical basis and long-standing engineering value. Problems arise when a calibration curve is asked to support conclusions outside its validated scope.
Flaw morphology, local penetration, combined damage, and structural backgrounds can make field signals depart from the calibration relationship. Software can still return a precise-looking percentage, but confidence in that number requires additional evidence.
When a leaking tube is reported at just over 80% OD, the owner has reason to ask questions, and inspectors should explain, review, and verify the result carefully.
Phase contains depth information, but understanding an in-service flaw requires much more than phase alone.
References retained from the Chinese article
[1] Liao Shusheng. Analysis of Reliability Deviations in Eddy Current Inspection of Steam Generator Tubes Based on the Finite Element Method. Proceedings of the NDT Academic Annual Meeting, Wuhan, Hubei, pp. 88–91. English title is a translation of the cited Chinese title.
[2] Feng Jun, Wang Bo, Qi Pan. Method for interpreting ID eddy current indications in heat exchanger tubes. Nondestructive Testing, 2017, 39(9):43–48. English title is translated.
[3] Bakhtiari S, et al. Assessments on Eddy Current Detection of Cracking Near Volumetric Indications in Steam Generator Tubes. NUREG/CR-7291, 2022, Chapter 4, Figure 4-2.
[4] U.S. NRC. Information Notice 2004-17: Loose Part Detection and Computerized Eddy Current Data Analysis in Steam Generators. August 25, 2004, main text p. 2.
[5] Nan Tong, Zhang Ming, Hu Fang. Eddy current inspection of heat transfer tubes in an industrial cooling-water heat exchanger at a power plant. Nondestructive Testing, 2024, 46(3):74–78. English title is translated.
All figures are conceptual, not measured data or finite-element outputs, and are not to scale. The applicability of numerical research findings is governed by the original studies.